Does the P/E of the DOW Predict Major Market Moves?
Logic dictates that the Price to Earnings (“P/E”) Ratio of a stock market index such as the Dow Jones Industrial Average (“DJIA”) should be of some assistance in predicting major moves.
If the P/E is expected to work as a value indicator for individual stocks, then it should work all the better for a stock index. This is because a stock index averages out a lot of random events that can happen to individual stocks.
If the P/E on the DJIA is under 10 many investors would conclude that the market was “cheap” and that it was a good time to invest. Conversely, if the DJIA were much above 20, many investors might conclude that the market was “expensive” and that it would not be such a good time to invest.
In this article, I examine past data to see if the DJIA P/E would have provided good market signals or not.
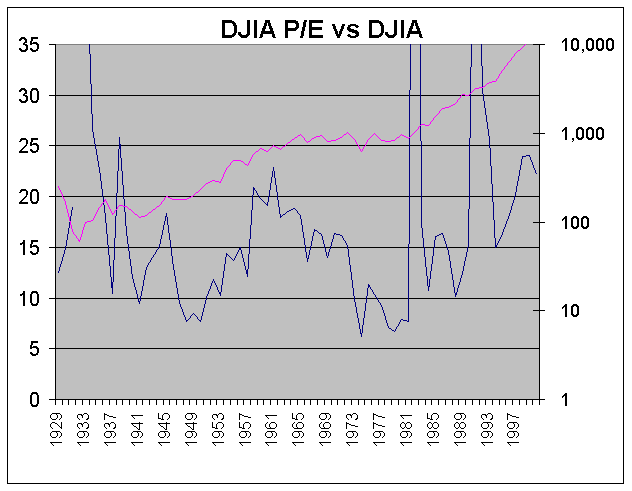
In this graph the DJIA declines sharply from 1929 to 1933. It then rises until 1936, then falls until 1941, then rises fairly steadily and sharply until 1965, then sideways or down until 1981, then sharply upward until 1999 and has declined since.
The P/E was very volatile over the period and does not seem to be a very good predictor. However, we can see that when the P/E was under 10, those were very good time to invest.
The P/E is very volatile, even though the Price or DJIA is more stable. This is because the total earnings on the DJIA are very volatile. During recessions the earnings can plummet. In some cases a number of DOW companies incurred large losses and the the DOW earnings fell sharply. This can result in the P/E ratio going very high such as in 1933, 1982 and 1991.
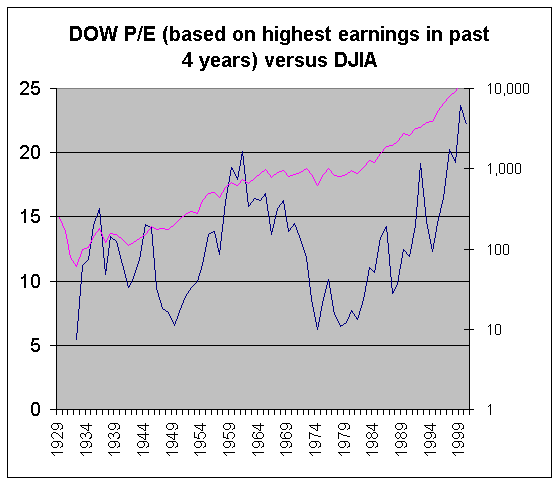
To correct for this I graphed a revised version of the P/E against the DJIA. In this case the P/E is calculated using the highest earning in the current year or the prior 3 years. This graph gives a much better result.

In 1936 a P/E (based on highest earnings in the past 4 years) of just over 15 signaled a down-turn in 1958, the P/E went to 18.8 a P/E of about 19 did not stop the market from rising substantially through 1965 (though with much volatility). In 1992 the P/E spiked to 19.2, but the market continued its very sharp rise. In 1997 the P/E was 20.2 and has remained high since then. But the market down-turn did not arrive until 2000.
Overall, it would not have been a very good strategy to get out of the market at what appeared to be high P/E levels. (But arguably there is some indication here that P/E’s over 20 are dangerous.) P/E’s under 10 were good times to invest except that in some cases it took some years before the market turned upward.
In theory, the P/E ratio should rise as interest rates decline.
The equation for an annuity is:
Price = Earnings / (risk free return – growth + market risk premium)
Roughly, we might expect both the growth and the market risk premium to both be about 4% and so “cancel out”.
Thus: Price = Earnings / risk free return
Price/Earnings = 1/risk free return
Price/Earnings * risk free rate = 1
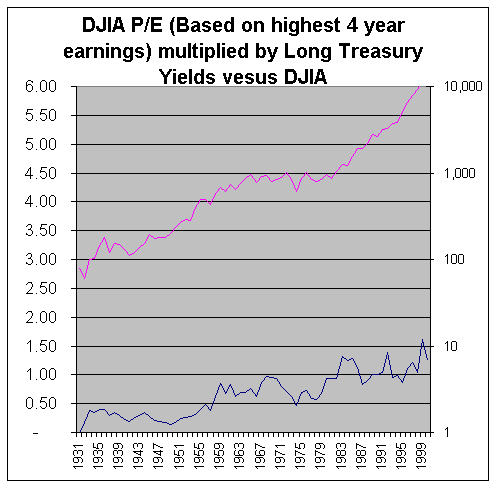
So, I can make an argument that the P/E multiplied by the risk free rate should equal about 1. Numbers much above 1 would indicate an over-valued market.
The results are graphed below:

In theory, this view of the P/E corrects for changes in long term interest rates. Unfortunately, following this rule would have caused an investor to miss out on most of the great bull market of the 80’s and 90’s. This rule is also more complex to apply.
Conclusion:
The ability of the P/E to provide signals about the DJIA is quite disappointing and does not match theory very well. However, it does appear that a DJIA P/E below 10 represents a good point to invest and that a DJIA of more than about 20 is dangerously high. It is very important to note that the P/E should be calculated using the highest DJIA earnings in the past 4 years. This prevents being misled by a P/E that spikes higher due to drop in earnings. Earnings will tend to recover. When the P/E rises above 20 due to higher prices (rather than lower earnings) investors should be quite cautious. This will by definition be a period of great optimism about the market as prices are bid up, but this is a time to be cautious. Because the DJIA P/E that will be reported in the press will be based on the latest annual earnings rather than the highest earnings in the past 4 years, investors need to be careful not to be misled.
August 31, 2001
