
Canada’s GDP by Industry
Which industries contribute the most to Canada’s economy? In terms of Gross Domestic Product (GDP) what are the percentages from oil and gas, real estate, construction, government services, forestry, farming, financial services and manufacturing etc.? The answers below might surprise or even shock you.
Firstly, what is the meaning of GDP?
GDP or Gross Domestic Product refers to the total dollar value of recorded economic production within a country. It measures the final value of all goods and services produced. The GDP of a particular industry is (roughly) the value of its sales minus the costs of goods or services purchased from other entities. The GDP of a particular industry measures the economic activity directly generated by that industry. The GDP of a particular industry is not a measure of its profit or value added since it does not deduct the cost of labour from the value of sales.
GDP is often criticized because it does not include the value of unpaid work or of unreported economic activities such as the “underground economy” or the value of “do-it-yourself” labour. Nevertheless, GDP is the best available figure for use in understanding the economy and the relative importance of each industry to the economy. There is one strange exception to the rule of not including unpaid and unreported economic activities. GDP includes a significant amount for the “imputed” rental value of owner-occupied houses.
What is Canada’s GDP by industry or sector?
As of Q4 2024, Canada’s reported GDP per year, in 2024 dollars, was running at $3.135 trillion or $3,135 billion per year.
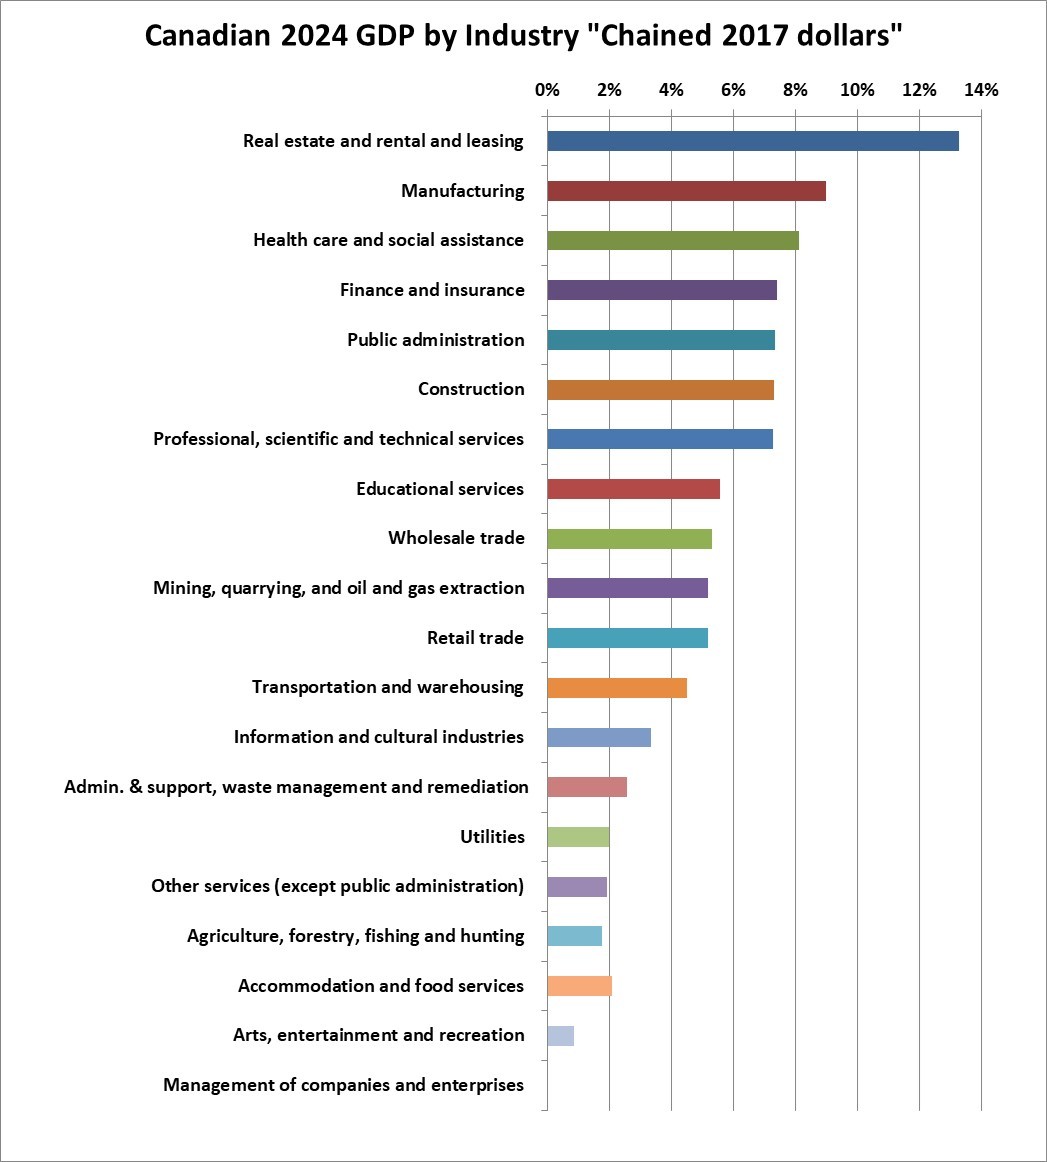
The following chart shows the percentage contribution of the various goods and services sectors to the total as of December 2024. Note however that this is based on something Statistics Canada calls 2017 chained dollars, which (I understand) basically assumes that there were no relative price changes among the sectors since 2017. I would prefer to use current dollars. However, for complicated reasons, Statistics Canada produces figures on GDP by industry in current dollars only on a three year lag basis. Chained dollars do a good job of measuring changes in volume or activity over time but may distort the relative contributions by segment in today’s dollars. This may be particularly true for commodity industries where price changes can be far different than the overall inflation level.
Data Source: Statistics Canada
https://www150.statcan.gc.ca/t1/tbl1/en/tv.action?pid=3610043403
The figures show that “Real estate and rental and leasing” is the largest segment of Canada’s economy at 13.2% of the total. This category (strangely) includes the “imputed” rental value of owner-occupied homes and that explains why this component is so very large. A large component here is the renting / leasing of real estate but it also includes auto and equipment leasing. Most retailers and office users rent their space. This category includes real estate brokers. Note that this category does not include constructing real estate! The high percentage related to the use of real estate (plus auto and equipment leasing) may seem high. But it includes the imputed rental value of owner occupied homes.
Manufacturing, while it may be lower than in years past, is still a very large portion of GDP and is the second largest component at 9.6%. Note that manufacturing includes process industries such as oil refineries, pulp mills and chemical plants.
Surprisingly, mining, quarrying, and oil and gas extraction has fallen down to the tenth largest item at 5.3% of total GDP. It would rank significantly higher than that in current dollars as opposed to 2017 chained dollars. The mining, quarrying and oil and gas extraction segment would rank higher in current dollars since oil prices were considerably higher in 2023 versus 2017.
Review the rest of the chart to see the composition of the Canadian economy and the percent contribution of different segments.
In total, goods-producing industries contributed for 26% of Canada’s GDP while service-producing industries contributed 74% of GDP. The public sector (which would be mostly or almost entirely service-producing) contributed 21% of the total GDP.
See the link to the source data just above to see the raw data if desired.
Who Consumes Canada’s GDP?
Canada’s 2023 GDP was consumed in the following fashion: (Q3 figures seasonally adjusted at annual rate)
Personal Household consumption: 59%
Government consumption: 22%
Investment in non-residential structures 8.5%
Investment in residential buildings 6.5%
Investment in intellectual property and inventory 2%
Government Investment: 4%
Net Exports: -2%
Total: 100%
When you hear that consumers “account” for most of Canada’s GDP, that does not mean that businesses account for little. In fact Businesses and (yes) government create the GDP and consumers consume the largest share. Government also consumes a large share but this is done to serve people (those same consumers) for example direct service in the case of education and health care and other direct services and indirect service in the case of police, the court, the army and other government services. This should not be considered surprising or alarming. Why else should things be produced except for consumption? (and for some investment to fuel future consumption).
A surprisingly large 21% of Canada’s GDP is expended on investment in (the creation of) longer lasting assets such as buildings (including houses) and equipment rather than being consumed for immediate gratification. This includes replacing and upgrading worn out buildings and assets which may account for it being so high.
END
Shawn Allen – shawn@investorsfriend.com
Investorsfriend Inc.
March 4, 2025