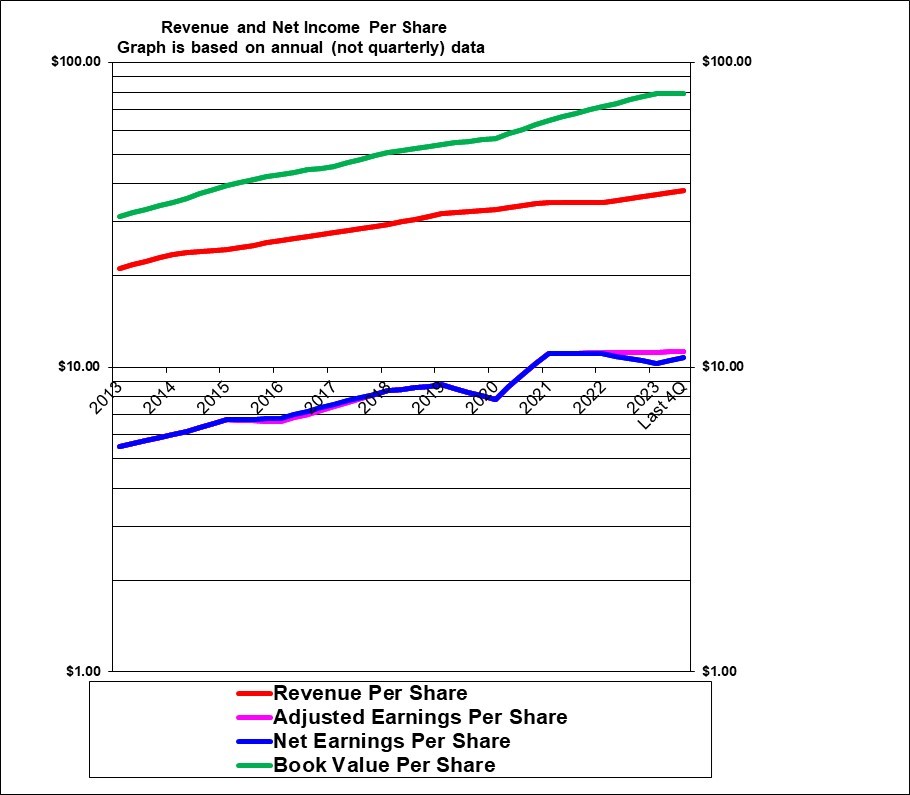
Royal Bank’s revenue per share (the red line) has grown at a relatively steady rate over the years, increasing at a compounded average of 5.8% per year in the period shown. Earnings per share (the blue line) increased at a higher compounded average of 7.0% per year. Book value per share has increased very steadily at a compounded average of 9.3% per year. These increases were achieved despite paying out roughly half of annual earnings in cash dividends. The earnings spike in 2021 was boosted by a reversal of expected loan losses booked in 2020 that did not materialize. But it’s also do to higher than normal business growth in 2021. Earnings growth in 2022 was only 1% because of the earnings spike in 2021. Earnings were flat in 2023 partly due to higher loan losses.
| Royal Bank of Canada (RY, Toronto and U.S.) | |
| RESEARCH SUMMARY | |
| Report Author(s): | InvestorsFriend Inc. Analyst(s) |
| Author(s)’ disclosure of share ownership: | The Author(s) hold shares |
| Based on financials from: | Oct. ’23 Y.E. +Q2 ’24 |
| Last updated: | June 8, 2024 |
| Share Price At Date of Last Update: | $ 146.35 |
| Currency: | $ Canadian |
| Generic Rating (This rating does not consider the circumstances of any individual investor and is therefore not specific advice for any individual): | (lower) Buy rated at $146.35 |
| Qualifies as a stock that could be bought with confidence to hold for 20 years? | Yes! |
| Has Wonderful Economics? | Yes |
| Has Excellent and Trustworthy Management? | Yes |
| Likely to grow earnings per share at an attractive rate over the next decade? | Yes |
| Positive near-term earnings outlook? | Probably not given loan losses and possible recession |
| Valuation? | Neutral |
| SUMMARY AND RATING: The graph of revenues per share (red line) shows strong and relatively steady historic growth but flat earnings in the past couple of years. The earnings per share line shows quite strong growth over the years but with an earnings decline in 2020 primarily due to estimated loan losses caused by the pandemic. The losses did not materialise and were reversed in 2021 causing the 2021 earnings to be artificially high but earnings were maintained at that level in 2022 and 2023. The Value ratios would support a rating of Buy to (higher) Buy. Management quality appears strong. The insider trading signal is neutral. Executive compensation is high but not a concern given the size of this bank. The outlook is uncertain given that the latest quarter was quite strong but loan losses are increasing and a recession seems probable. RBC has strong economics and some strong competitive advantages in terms of its scale and established market position. It appears to be a business that can reliably predicted to continue to grow over the years. RBC, however (like all banks) is highly leveraged and therefore there is some small risk of very major problems in certain scenarios. There are also potential risks associated with possible lower housing prices, recession and mark to market losses on some investments. Overall RBC is a consistent money maker but achieves this with high leverage which is managed through a finely tuned risk management system. Overall we would rate this as a (lower) Buy at this time. | |
| MACRO ENVIROMENT: The huge increase in interest rates has pushed up their interest income and their interest expense massively. But net interest margin is up more modestly. The impact of higher interest rates on loan losses remains to be seen. The projected 2023 mild recession is a headwind. | |
| LONG TERM VALUE CREATION: Royal Bank has created excellent value in the long term. | |
| DESCRIPTION OF BUSINESS: Last updated Q4, 2023 and Q2 2024 . Royal Bank of Canada is the country’s largest bank with assets of $2.03 trillion dollars, a common equity market cap of $207 billion dollars, 1247 bank branches, 4341 automated teller machines and 94,000 employees in 29 countries. Earnings by segment as of Q2 2024 were 53% from personal and commercial banking (in Canada, the U.S. and the Caribbean) [And 68% of the revenue in this personal & commercial segment is Canadian personal banking] , 28% from capital markets (includes equity and debt origination and distribution, and structuring and trading), 14% from wealth management – down from 20% in 2019 (mainly Canada, the U.S., the U.K, the channel islands and Asia), 5% from insurance (In Canada and reinsurance outside Canada). The return on equity for personal and commercial banking is reported at a stunningly profitable 28% and this high level has been sustained for years! (The high ROE is presumably due to massive leverage on CMHC mortgages as well as lucrative fees), 10% ROE for wealth management, 37% ROE for insurance (which seems extraordinarily high but might be explained by selling high margin insurance like life insurance on mortgages and by reinsurance which will likely occasionally have losses), and 15% ROE in capital markets (similar to the 13% of 2018). Overall corporate ROE was 14%. Based on 2017 figures Canada accounts for 61% of revenue, The U.S. accounts for 23% of revenue, International (37 countries) accounts for 17% of revenue. For 2019 (and 2018), 57% of revenue is from non-interest income (investment management fees, account service charges, foreign exchange fees and card fees, insurance, underwriting and trading) and 43% from net interest income. Interestingly, RBC has very little (only 5%) of its Personal and Commercial banking outside of Canada but its Wealth Management business in the U.S. is almost twice as large as its Canadian wealth management level. | |
| ECONOMICS OF THE BUSINESS: (Updated as of Q1 2023) RBC’s economics are strong. It does however like most banks depend on very high (even extraordinarily high) leverage. Its profit as a percent of revenue was recently 31%. However that translates into a profit on (ending) assets of only 0.83% as revenue is only 3% as large as the assets. This 0.83% return on ending assets was then leveraged up to 15.9% return on ending equity as ending common equity was only 524% as large as the assets (The common equity is extremely highly leveraged – which is typical for banks). The high ROE indicates that the economics of the business are very good but it is achieved through massive leverage which can be risky. The economics are also strong in that the business is of a recurring nature and the customers tend to be “sticky”. | |
| RISKS: See annual report for a full discussion of risks. Data breaches are a definite risk. New disruptive technologies are a possible risk. Banks always run the risk that borrowers will fail to pay their loans. This risk is increased by the very large leverage of most banks and of Royal Bank in particular. However, the bank has in place numerous and complex risk management strategies that are designed to prevent its risks from creating any major financial problems for the bank. Share owners must place their faith in management and its risk management abilities. RBC has operations in tax havens including the Caribbean, and (of more concern) the Channel islands and Luxemburg. It could face risks in that area if it is found to be helping customers evade income taxes. As of 2023 there are added risks in regard to bad loans due to borrowers struggling with higher interest rates and due to a projected mild recession. | |
| INSIDER TRADING / INSIDER HOLDING: Based on J April 1, 2022 to April 3, 2023: Insiders are shown buying fairly regularly “under a plan” but these purchases don’t give much of a signal since they are set up in advance. Four insiders, including the CEO, sold shares after exercising options. In two cases very substantial number of shares. Most insiders were holding and not selling (which is positive). Overall, the insider trading signal is about neutral. | |
| WARREN BUFFETT’s CRITERIA: Buffett indicates that all investments must pass four key tests: the business is simple to understand and predict (marginal pass because the various sectors and geographies make RBC more complex and particularly because it is very hard to judge the risk of this highly leveraged business), has favorable long-term economics due to cost advantages or superior brand power (pass due to scale and established history of high ROE achievement), apparently able and trustworthy management (pass), a sensible price – below its intrinsic value (marginal pass), Other criteria that have been attributed to Buffett include: a low debt ratio (arguably a fail given the massive leverage although that is not unusual in banking), good recent profit history (pass) little chance of permanent loss of the investors capital (pass – although with high leverage there is some risk) a low level of maintenance type capital spending required to maintain existing operations excluding growth (pass). | |
| MOST RECENT EARNINGS AND SALES TREND: The recent earnings growth is somewhat distorted by volatile swings in the allowance for credit losses which are NOT adjusted for in adjusted earnings. Banks strangely deduct interest expense in arriving at Revenue. Revenue per share growth in the past four quarters beginning with the most recent (Q2, 2024) was 12%, minus 1%, 0% and 7%. Adjusted earnings per share (affected by volatile estimates for credit losses) were up 9%, down 6.5%, down 5% and up 11%. In 2023, overall revenues per share were up 5% but adjusted earnings per share were unchanged. In 2022, overall revenues per share were flat while adjusted earnings per share were up just 1%. Overall, the recent earnings trend is very flat and it’s not year clear in the growth in the latest quarter will be sustained. Historic figures: In 2021 overall the earnings per share were up by a huge 42% but a large part of that was loan loss reversals and revenues per share were up 5.5%.. In 2020 overall, the earnings per share growth was a decline of 11% (mostly due to estimated pandemic loan losses) and revenue per share declined 2% partly due to lower interest margins. In 2019 overall, the earnings per share growth was 5% and revenue per share growth was 9%. In 2018 overall, the earnings per share growth was 13% (possibly boosted by the Trump tax cuts) and revenue per share growth was 6%. In 2017 overall, the earnings per share growth was 12% and revenue per share growth was 6%. | |
| INDUSTRY SPECIFIC STATISTICS: In Q2 2024, the provision form credit loss was 0.41%. For fiscal 2023, the provision for credit loss was 0.29%. For fiscal 2022, the provision for credit loss at 0.06% was abnormally low. For fiscal 2021 Provision for Credit Loss was negative 0.10% as they reversed loss estimates from 2020 which was a hefty 0.63% due to the pandemic and was sharp increase from 2019 at 0.31% and 2018 at 0.23%. Gross impaired loans at end of 2023 were 0.42% and as of Q2 2014 were 0.55% Gross Impaired Loans in 2022 were just 0.26% and in 2021 were 0.31% down from 0.47% in 2020 and 2019. Net interest margin in the personal and commercial sector in 2023 was 2.74%. Net Interest Margin on average earning assets was 1.50% in 2023 in 2022 was 1.48% and in 2021 was 1.28% down from 1.55% 2020 and continuing a downward trend as 2019 was 1.61% and 2018 was 1.64% on average earning assets. | |
| Earnings Growth Scenario and Justifiable P/E: With a dividend yield of 3.8%, and a P/E of 13.3% it is pricing in growth in the range of about 7%. | |
| VALUE RATIOS: Analysed at Canadian $146.35 (U.S. $106.39). The price to book value ratio at 1.85 is reasonably attractive considering the 14.6% ROE. The trailing P/E ratio is moderately attractive at 13.0. The dividend yield is reasonably attractive at 3.9% and amounts to a payout of 51% of earnings. The Return on equity is quite high at 14.6% BUT this is a decline from historic levels around 17%. Earnings per share have grown at a compounded average of 6.0% in the past five fiscal years and revenue per share has grown at a compounded average of 4.7% per year. This is good revenue growth considering that about half of earnings are paid out as dividends. We calculate the intrinsic value to be $124 per share if earnings can be expected to grow at 4% per year and the P/E declines to 10 and (more optimistically) $178 if earnings per share grow at 6% per year for five years and the P/E rises slightly to 14. These intrinsic value calculations use a required return of 7.0%. These value ratios support a rating of Buy to (higher) Buy. | |
| TAXATION: | |
| SUPPORTING RESEARCH AND ANALYSIS | |
| Symbol and Exchange: | Royal Bank of Canada |
| Currency: | $ Canadian |
| Contact: | invesrel@rbc.com |
| Web-site: | www.rbc.com/investorrelations |
| INCOME AND PRICE / EARNINGS RATIO ANALYSIS | |
| Latest four quarters annual sales $ millions: | $53,301.0 |
| Latest four quarters annual earnings $ millions: | $15,073.0 |
| P/E ratio based on latest four quarters earnings: | 13.6 |
| Latest four quarters annual earnings, adjusted, $ millions: | $15,784.0 |
| BASIS OR SOURCE OF ADJUSTED EARNINGS: For the most recent few periods we have used a new adjusted earnings figure provided by management. They likely started doing this because of an usual retroactive tax hit in Q1 2023. Prior to that we had not made any adjustments except for a gain on a sale in 2017 and 2016. Loan loss estimated can also be quite volatile but we did not adjust for that. | |
| Quality of Earnings Measurement and Persistence: Earnings measurement is probably of reasonably high quality but there are certainly some estimates involved such as for loan losses. Some mark to market changes in asset values flow to the net income. | |
| P/E ratio based on latest four quarters earnings, adjusted | 13.0 |
| Latest fiscal year annual earnings: | $14,369.0 |
| P/E ratio based on latest fiscal year earnings: | 14.3 |
| Fiscal earnings adjusted: | $15,586.0 |
| P/E ratio for fiscal earnings adjusted: | 13.2 |
| Latest four quarters profit as percent of sales | 29.6% |
| Dividend Yield: | 3.9% |
| Price / Sales Ratio | 3.86 |
| BALANCE SHEET ITEMS | |
| Price to (diluted) book value ratio: | 1.85 |
| Balance Sheet: (Updated Q2, 2024) The composition of assets is as follows: 47% of assets are loans (of which 63% are categorized as retail and 37% as wholesale), 15% assets purchased under reverse repurchase agreements and securities borrowed (essentially short term secured lending and 93% of this is offset by assets sold under similar arrangements that appear to be like short-term deposits much of which are 1 to 6 month terms.), 20% securities – which would mostly pay a cash yield or interest so are like loans but highly liquid (42% of which are held for trading and 58% are held for investment), 6% derivatives (which appear to be mainly for risk management purposes and are fully offset by derivative liabilities), 5% “other” – which is mostly financial receivables and 5% cash and deposits with other banks, and less than 1% goodwill. Liabilities consist of 65% deposits (of which 38% are personal, 60% are business and government and 2% from other banks), 7% derivatives, 14% obligations for assets sold under repurchase agreements (essentially short-term borrowing or perhaps equivalent to a very short-term deposit where the “depositor” has security – the great majority of these are under 1 month.), 1.6% obligations related to securities sold short, 6% “other” – which is mostly financial payables of various kinds, 5.5% common equity, 0.7% subordinated debt and 0.5% preferred shares. In general the balance sheet shows some complexity in that loans are only 47% of assets (62% if assets purchased under repurchase agreements are treated as loans). Common equity at about 5.5% is very highly leveraged which is typical of banks. | |
| Quality of Net Assets (Book Equity Value) Measurement: It is difficult to judge the reliability of the net book value. Not all assets are marked to market and the leverage is so high that a small error in asset values could wipe out a large chunk of equity. On the other hand most of the assets are very liquid and a significant portion are marked to market. | |
| Number of Diluted common shares in millions: | 1,414.2 |
| Controlling Shareholder: No one is allowed to own more than 10% of the shares. | |
| Market Equity Capitalization (Value) $ millions: | $206,968.2 |
| Percentage of assets supported by common equity: (remainder is debt or other liabilities) | 5.5% |
| Interest-bearing debt as a percentage of common equity | 12% |
| Current assets / current liabilities: | not revealed |
| Liquidity and capital structure: With common equity of only 5.2% of the asset level, the capital structure appears to be weak in that regard. But this is apparently typical for large banks. And, the assets are considered to be highly liquid and safe and credit rating agencies (S&P) rate the debt at A. On a risk-weighted basis and by bank standards it balance sheet is considered strong. | |
| RETURN ON EQUITY AND ON MARKET VALUE | |
| Latest four quarters adjusted (if applicable) net income return on average equity: | 14.6% |
| Latest fiscal year adjusted (if applicable) net income return on average equity: | 14.8% |
| Adjusted (if applicable) latest four quarters return on market capitalization: | 7.6% |
| GROWTH RATIOS, OUTLOOK and CALCULATED INTRINSIC VALUE PER SHARE | |
| 5 years compounded growth in sales/share | 4.7% |
| Volatility of sales growth per share: | strong, steady growth |
| 5 Years compounded growth in earnings/share | 4.3% |
| 5 years compounded growth in adjusted earnings per share | 6.0% |
| Volatility of earnings growth: | moderately volatile |
| Projected current year earnings $millions: | not available |
| Management projected price to earnings ratio: | not available |
| Over the last ten years, has this been a truly excellent company exhibiting strong and steady growth in revenues per share and in (adjusted) earnings per share? | Yes |
| Expected growth in EPS based on adjusted fiscal Return on equity times percent of earnings retained: | 7.3% |
| More conservative estimate of compounded growth in earnings per share over the forecast period: | 4.0% |
| More optimistic estimate of compounded growth in earnings per share over the forecast period: | 6.0% |
| OUTLOOK AND AMBITIONS FOR BUSINESS: RBC’s earning assets have adjusted upwards very quickly with higher interest rates. The outlook is uncertain given that the latest quarter showed strong growth after two quarters of decline. Loan losses are still increasing and a recession seems likely. There is also possible headwinds in terms of mark to market losses on investments and loan losses on non-CHMC mortgages. The reinsurance business can occasionally lead to material losses. In general, the outlook for the near-term is uncertain. | |
| LONG TERM PREDICTABILITY: Royal Bank of Canada has been growing its assets and earnings per share for decades. It seems reasonable to assume that it can continue to grow with the economy. But it is possible though that newer technologies will disrupt banking leading to lower profits. Technology is allowing for big cost reductions as transactions become more and more digital and self-serve. | |
| Estimated present value per share: We calculate $106 if adjusted earnings per share grow for 5 years at the more conservative rate of 4% and the shares can then be sold at a P/E of 12 and $143 if adjusted earnings per share grow at the more optimistic rate of 8% for 5 years and the shares can then be sold at a HIGHER P/E of 14. An 8% growth might be quite doable since the 2020 base was depressed by the pandemic. Both estimates use a 6.0% required rate of return. | |
| ADDITIONAL COMMENTS | |
| INDUSTRY ATTRACTIVENESS: (These comments reflect the industry and the company’s particular incumbent position within that industry segment.) Michael Porter of Harvard argues that an attractive industry is one where firms are somewhat protected from competition based on the following four tests. Barriers to entry (Pass, there are certainly barriers to achieving a large scale in banking since it is difficult to acquire customers although new entrants are emerging and could become a concern in future). No issues with powerful suppliers (pass). No issues with dependence on powerful customers (pass), No potential for substitute products (pass) No tendency to compete ruinously on price (marginal pass – they may compete aggressively on some products but there are some parts of the business where there appears to be little price competition such as credit card rates and currency exchange rate fees.). Overall this industry appears to be attractive for an established large incumbent. | |
| COMPETITIVE ADVANTAGE: Size and scale are advantages. Customers find it inconvenient to switch banks and therefore having an established large market share is an advantage. They indicate that there are significant barriers to entry in the reinsurance part of their business. | |
| COMPETITIVE POSITION: Royal Bank is the largest Bank in Canada. In personal and commercial banking it is number 1 or 2 in all key product categories. It has a very strong competitive position in Canada and competes effectively in certain U.S. and European lines of business. | |
| RECENT EVENTS: Has just completed the $13.5 billion acquisition of HSBC Canada it’s largest acquisition ever (apparently bigger than the City National acquisition of several years ago). Also acquired a wealth management business in the U.K called Brewin Dolphin. Royal Bank, like the other big Canadian banks, rather suddenly has a significant 26% of mortgages with remaining amortizations over 35 years. This is due to floating rate mortgages with (temporarily) fixed payments and due to allowing customers to extend their mortgages to deal with higher rates. It appears (page 22 Q1 report) that most of these mortgages are uninsured. The recent huge increases in interest rates has led to a massive increase in their interest income and also a huge increase in interest expense. Provisions for credit losses became quite volatile with the pandemic and the recovery therefrom. Overall they continue to grow. | |
| ACCOUNTING AND DISCLOSURE ISSUES: The disclosure of large banks is voluminous. But we are always left with some questions. They measure revenue after deducting interest expense. In Q1 2023 we see mention that they have at least $95 billion in debt but we can’t find where it is on the balance sheet. They speak of trading revenues but it is often impossible to know if they refer to proprietary trading for their own account or merely collecting fees on customer trading activity, which is a vastly different thing. Net income is reported in a legal but misleading way. They fail to prominently show and focus the lower net income to common after deducting preferred share dividends and non-controlling interest. Accounting rules require gains on asset sales to be counted as revenue, which distorts the figure. Earnings are impacted by mark-to market changes in some assets and liabilities. Currency changes affect earnings. They did not show normalised earnings for the unusually high credit loss reserves in 2020 or the negative estimated loans losses in 2021 which would have been quite useful. | |
| COMMON SHARE STRUCTURE USED: Normal, one vote per share. | |
| MANAGEMENT QUALITY: Overall, the quality appears to be high. Listening to the CEO speak, he seemed to be a very able individual. He is very much focused on applying new technology to banking. Management indicates they are focused on Total Shareholder Return through performance over a 3 to 5 year period. This could be dangerous in that it could cause a focus on the share price rather than long-term earnings or could lead to excessive leverage in order to attempt to boost earnings. We do not have a strong opinion about management. We are somewhat concerned about why they were ever involved in Caribbean wealth management or (of more concern) operations in the Channel Islands and Luxemburg, which are known as tax havens but they do seem to be reducing their business in such tax havens. | |
| Capital Allocation Skills: Given the high ROEs in all of the various divisions of the Bank, capital allocation skills appear to be strong based on past results. | |
| EXECUTIVE COMPENSATION: Updated with April 2020 figures. Compensation is generous with the top five officers earning total compensation of $5 million to $14 million. Given the size of the bank and its earnings, this is not a concern. | |
| BOARD OF DIRECTORS: Warren Buffett has suggested that ideal Board members be owner-oriented, business-savvy, interested and financially independent. The Board members at RBC are well qualified. Most are independently relatively wealthy and hold more shares than the minimum target of $750k. A number of the members are quite recent and none have been in place since before 2005 and the average tenure is only about 5 years. We’d like to see a bit more continuity that that. | |
| Basis and Limitations of Analysis: The following applies to all the companies rated. Conclusions are based largely on achieved earnings, balance sheet strength, achieved earnings per share growth trend and industry attractiveness. We undertake a relatively detailed analysis of the published financial statements including growth per share trends and our general view of the industry attractiveness and the company’s growth prospects. Despite this diligence our analysis is subject to limitations including the following examples. We have not met with management or discussed the long term earnings growth prospects with management. We have not reviewed all press releases. We typically have no special expertise or knowledge of the industry. | |
| DISCLAIMER: All stock ratings presented are “generic” in nature and do not take into account the unique circumstances and risk tolerance and risk capacity of any individual. The information presented is not a recommendation for any individual to buy or sell any security. The authors are not registered investment advisors and the information presented is not to be considered investment advice to any individual. The reader should consult a registered investment advisor or registered dealer prior to making any investment decision. For ease of writing style the newsletter and articles are often written in the first person. But, legally speaking, all information and opinions are provided by InvestorsFriend Inc. and not by the authors as individuals. The author(s) of this report may have a position, as disclosed in each report. The authors’ positions may subsequently change without notice. | |
| © Copyright: InvestorsFriend Inc. 1999 – 2024. All rights to format and content are reserved. | |